
Bill Mitchell-en Helicopter money is a fiscal operation and is not inherently inflationary1
Sarrera: ikus Helikoptero dirua: eragiketa fiskala (1)
Segida:
(xii) AEB-ko gobernuak bere zor publikotik nahi duen beste eros dezake2
(xiii) Zenbait datu eta grafiko AEB-ko zor publikoaz3
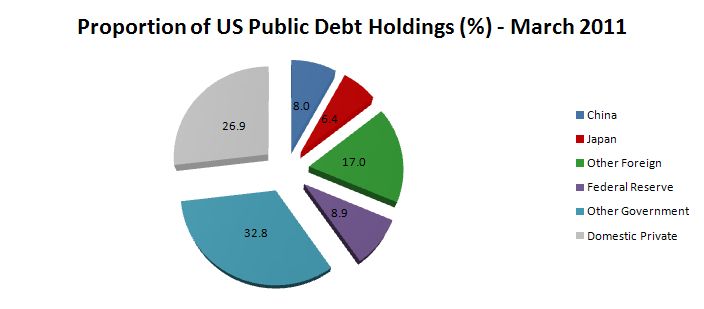
(a) Zor publikoa, 2011n4
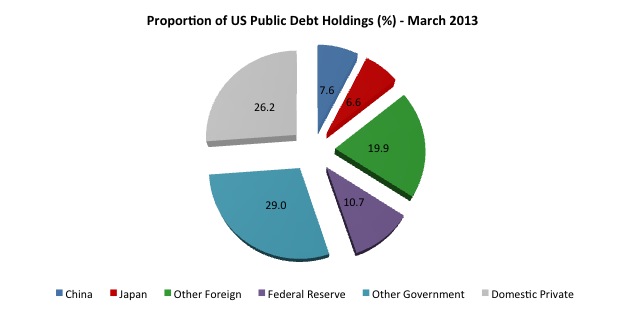
(b) Zor publikoa, 2013an5
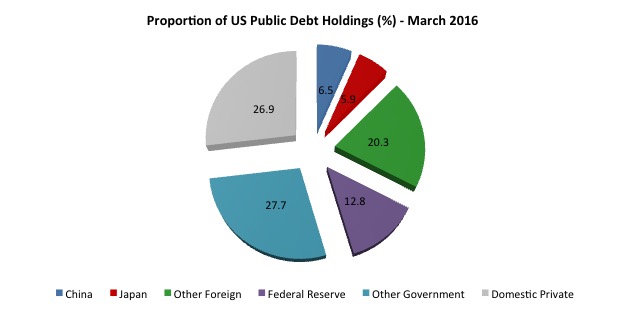
(c) Zor publikoa, 2016an6
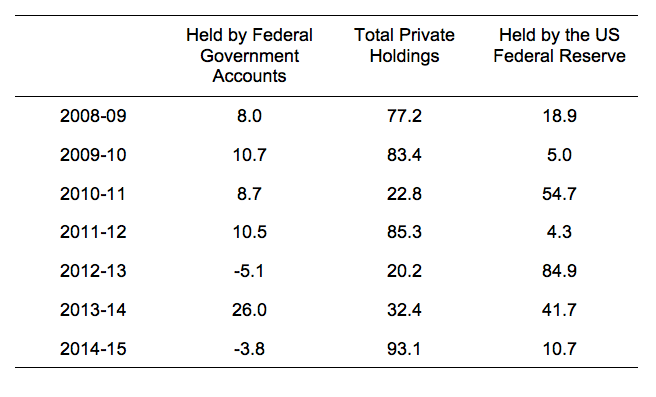
(d) Taula: gobernu federalaren zorraren aldaketa globala, 2009tik 2015etik7
Proportions of the total change in US federal government debt (% of total change)
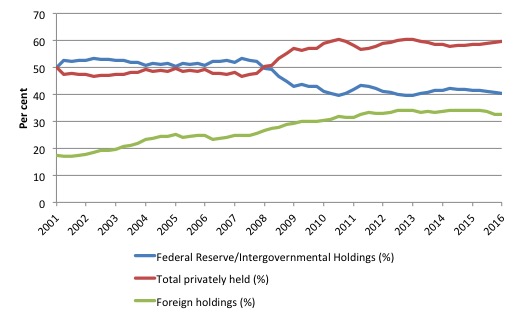
(e) AEB-ko zor publikoa 2001etik 2013ra8
(xiv) Azpimarratzeko zenbait puntu:
(1) Zor publikoaren eskari pribatua: arriskurik gabekoa9
(2) Atzerritarrek ez dute finantzatzen AEB-ko gobernuaren gastua10
(3) AEB garaile11
(4) Oharra12
(5) Banku zentrala eta gobernu zorra13
(6) Ez dira inflazio puntarik ikusi, aipatutako eragiketen ondorioz14
Ondorioak
(A) Korronte nagusiko ekonomialariek ez dute OMF15 (Overt Monetary Financing) ulertzen, ezta haren eraginak ere
(B) Helikoptero dirua eragiketa fiskala dela ulertu arte, eta ez eragiketa monetarioa (QE bezalakoa, kasu), ekonomialari horiek segituko dute zentzugabeko txostenak plazaratzen
2 Ingelesez: “The US government can buy as much of its own debt as it chooses
Here is an update on some research I did in this regard a few years ago which appeared in these blogs – The nearly infinite capacity of the US government to spend – When the government owes itself $US1.6 trillion – and more recently (September 2013) – The US government can buy as much of its own debt as it chooses.”
3 Ingelesez: “There are a few data sets that you can pull together to break the total US public debt outstanding into various categories. The US Treasury Department provides an extensive data resource – search for Ownership of Federal Securities. The US Treasury also provide data which provides a Foreign breakdown.
The US Federal Reserve provides Consolidated Balance Sheet data.”
4 Ingelesez: “The following pie-chart shows the proportions of total US Public Debt held by various “interesting” categories as at March 2011. This chart tells you that the government sector held about 42 per cent of its own debt in March 2011. These holdings were either in the intergovernmental agencies or the US Federal Reserve.
The Chinese holdings were around 8 per cent of the total and hardly consistent with the rhetoric of the deficit terrorists that China was bailing the US government out.
The three largest foreign US debt holders at March 2011 were China (8 per cent); Japan (6.4 per cent) and Britain (2.3 per cent). The total foreign held share was equal to 31.4 per cent in March 2011.
The US Federal Reserve held 8.9 per cent of total US public debt in March 2011 – that is, more than China. The total holdings were around $US 1,274,274 million.”
5 Ingelesez: “The following pie-chart represents the situation in March 2013, two years later. This chart tells you that the government sector held about 39 per cent of its own debt in the March-quarter 2013 and the private sector held the rest.
The Chinese holdings had fallen to 7.6 per cent which has been about constant since the end of 2011.
The three largest foreign US debt holders at March 2013 are China (7.6 per cent); Japan (6.6 per cent) and the so-called Caribbean Banking Centers, which include Bahamas, Bermuda, Cayman Islands, Netherlands Antilles and Panama (1.7 per cent). The Oil Exporters come next (1.6 per cent). The Oil Exporters include (Ecuador, Venezuela, Indonesia, Bahrain, Iran, Iraq, Kuwait, Oman, Qatar, Saudi Arabia, the United Arab Emirates, Algeria, Gabon, Libya, and Nigeria).
The impact of the British austerity is noticeable. In March 2011, Britain was the third largest holder of US public debt (at 2.3 per cent of total US public debt). By March 2013, this had dropped to 0.95 per cent. They shed $US166 billion worth of US treasury securities in that 24 month period).
The total foreign held share of outstanding US public debt was equal to 34.1 per cent in March 2013 – which is a relatively stable proportion.”
6 Ingelesez: “The following pie-chart represents the situation in March 2016, three years later. This chart tells you that the government sector held about 40 per cent of its own debt in the March-quarter 2013 and the private sector held the rest.
The Chinese holdings had fallen further to 6.5 per cent in the three years to the March-quarter 2016. The two largest foreign US debt holders at March 2016 were China (6.7 per cent) and Japan (5.9 per cent).
The data no longer allows an easy breakdown for the Caribbean Banking Centers (Bahamas, Bermuda, Cayman Islands, Netherlands Antilles and Panama), which had been the third largest and the Oil Exporters (Ecuador, Venezuela, Indonesia, Bahrain, Iran, Iraq, Kuwait, Oman, Qatar, Saudi Arabia, the United Arab Emirates, Algeria, Gabon, Libya, and Nigeria) who had previously been number four.
The total foreign held share of outstanding US public debt was equal to 32.7 per cent in March 2016 – which is a relatively stable proportion but slightly down on the proportions found in 2013.”
7 Ingelesez: “The following Table shows the proportions of the total change in US federal government debt for the calendar years 2009 (so the change is between 2008-09 and so on) to 2014-15 (up to December 2015) accounted for by the main holders – Federal Government Accounts, Total non-government (private), which is, in turn, decomposed further into US Federal Reserve holdings. There are other components not included.
In 2011, the increases in the US Federal Reserve’s holdings accounted for 54.7 per cent of the total increase in US federal government debt. That fell away to 4.3 per cent in 2012 and then rose again to 84.9 per cent in 2014. In 2015, the proportion was 10.7 per cent.
There was a dramatic shift in the mix of debt holders other than Federal Government accounts in 2011 and 2013. The central bank can alter this proportion whenever they choose and that includes to purchase any debt that the private sector chooses not to purchase.
In other words, the US government (consolidated Treasury and central bank) can always assume the role as its own largest lender. That is, the Government can always borrowing from itself!
That is how nonsensical these voluntary conventions are. They sound robust but in the end the currency-issuer is the currency-issuer and can always work around the so-called constraints.”
8 Ingelesez: “The next graph shows the evolution from March 2001 to March 2013 of the US public debt by private, public and foreign holdings (%). The foreign holdings are a subset of the private series.”
9 Ingelesez: “There are some interesting points to note. At a time when the US public debt ratio has risen beyond what the mainstream claim is the danger point (80 per cent) – the point after which those spreadsheet mavens claim insolvency is nigh (Rogoff etc) – the private demand for US public debt has risen.
Private markets know that there is no substantive default risk involved in holding the US Treasury debt.”
10 Ingelesez: “The other point, in relation to the rising foreign share is that you cannot conclude that the foreigners (China, Japan etc) are ‘funding’ the US government. The US government is the only government that issues US currency so it is impossible for the Chinese to ‘fund’ US government spending.”
11 Ingelesez: “To understand the trend shown in the graph more fully we need to appreciate that the rising proportion of foreign-held US public debt is a direct result of the trade patterns between the countries involved (and cross trade positions).
For example, China will automatically accumulate US-dollar denominated claims as a result of it running a current account surplus against the US. These claims are held within the US banking system somewhere and can manifest as US-dollar deposits or interest-bearing bonds. The difference is really immaterial to US government spending and in an accounting sense just involves adjustments in the banking system.
The accumulation of these US-dollar denominated assets is the ‘reward’ that the Chinese (or other foreigners) get for shipping real goods and services to the US (principally) in exchange for less real goods and services from the US. Given real living standards are based on access to real goods and services, you can work out who is on top (from a macroeconomic perspective).”
12 Ingelesez: “Note that a worker in Detroit or some other degenerate industrial region in the US who is suffering from unemployment as a result of cheaper imports coming from nations with lower labour standards (pay and conditions) than the US is unlikely to agree with me. In his/her case I wouldn’t agree with me either.
But from the perspective of macroeconomics there is no issue.”
13 Ingelesez:”The point is that the US Federal Reserve Bank (as in the case of other central banks around the world) have been taking up significant proportions of the outstanding government debt in the last 10 years. In some years, this proportion has been very high.”
14 Ingelesez: “We didn’t observe any major inflationary spikes associated with these shifts in monetary operations underpinning the government debt-issuance (and deficit) outcomes.
Please read my blog – Direct central bank purchases of government debt – for more discussion on this point.
Also please read the following blogs – Building bank reserves will not expand credit and Building bank reserves is not inflationary – for further discussion.”


