
Bill Mitchell-en Never trust a NAIRU estimate
http://bilbo.economicoutlook.net/blog/?p=44910
(i) Sarrera gisa
… We have been finalising a Report on our latest estimates of the investment required to introduce a full-scale Job Guarantee in Australia. As part of that work, I have been going back through my NAIRU (Non-Accelerating Inflation Rate of Unemployment) estimates and updating data. I am also going to talk about that a bit in my presentation to the Economic Society of Australia tonight. That talk is about ultimately aimed at explaining the inflation fighting mechanisms inherent in the Job Guarantee, which is a centrepiece of Modern Monetary Theory (MMT). But to understand why that option is superior in efficiency terms, one has to know what the alternative buffer stock mechanism is. And that, of course, is the NAIRU orthodoxy. (…)
(ii) NAIRU delakoaz
The aim of my talk tonight is as follows:
To discuss “flattening the Phillips Curve”, full employment, the role of price anchors and automatic stabilisers versus discretionary fiscal policy, how the ‘price rule’ of stimul)us contrasts with the ‘quantity rule’ of conventional Keynesian pump-priming, and the choice between unemployed buffer stocks (the NAIRU) and employed buffer stocks (the NAIBER) in inflation management policy.
(…I
I have written about the NAIRU before and have done years of work on the topic:
1. My PhD thesis included a lot of technical work (theoretical and econometric) on the topic and buffer stocks.
2. In my 2008 book with Joan Muysken – Full Employment abandoned – we analysed the technical aspects of the NAIRU in detail.
3. Many refereed academic papers.
4. The following blog posts
(a) The NAIRU/Output gap scam reprise (February 27, 2019).
(b) The NAIRU/Output gap scam (February 26, 2019).
(c) No coherent evidence of a rising US NAIRU (December 10, 2013).
(d) Why we have to learn about the NAIRU (and reject it) (November 19, 2013).
(e) Why did unemployment and inflation fall in the 1990s? (October 3, 2013).
(f) NAIRU mantra prevents good macroeconomic policy (November 19, 2010).
(g) The dreaded NAIRU is still about! (April 6, 2009).
I don’t intend rehearsing the narratives in those blog posts again.
(iii) Grafikoa eta NAIRU delakoa
But here is an updated graph from 1960 to 2020 showing the old Australian Treasury TRYM estimates of the NAIRU, the current OECD estimates, and the actual unemployment rate.
The OECD data starts in 1985. The TRYM model was discontinued in 2011.
You can see the problem clearly without having to understand anything much.
If two agencies estimate the same concept that come up with the red and green lines, then something is amiss.
It turns out that lots is amiss.

While I won’t go into all the discussion that I covered in the blog posts referred to above, the following points are worth noting:
1. Proponents of the NAIRU as a useful policy construct have never explained the sudden jump from 1974 which coincided at the time with the rise in the actual unemployment rate.
The latter occurred as a result of the recession that followed the OPEC oil price hikes and was clearly understood in terms of a negative spending shock exacerbated by contractionary policy.
But conceptually shifts in the NAIRU have to be driven by shifts in microeconomic factors – the so-called structural factors, which are invariant to the economic cycle.
Why is that important?
Because if the structural factors (attitudes towards work, regulations such as minimum wages, income support levels, taxes, etc) fully determine the NAIRU and they are invariant to the economic cycle, which is driven by spending, then it would be difficult for the government to use expansionary fiscal policy to reduce the unemployment rate without incurring accelerating inflation.
That is exactly the notion that defined the entry of Monetarism and the Natural Rate Hypothesis (NRH) into their literature.
It is the causality that underpins their argument that there is only one unique unemployment rate consistent with stable inflation and fiscal policy adjustments (classic Keynesian policies) are unable to influence that rate and only cause inflation if the government tries to influence the level of unemployment.
The game is thus to accept that for given structural parameters, the unemployment rate where inflation stabilises is the ‘natural rate’ and if the government feels it is too high then they have to engage in structural changes which include reducing (scrapping minimum wages), reducing trade union bargaining power, cutting corporate taxation, increase the strength of activity tests for unemployment benefit recipients and even scrapping the benefit altogether.
You can see how the NAIRU is such a powerful pillar of the neoliberal deregulation agenda.
But, even if structural factors are determinant of the NAIRU, it remains the fact that if they are influenced in any way by the economic (spending) cycle, then the NAIRU becomes sensitive to government spending shifts and the whole Monetarist-NRH story crumbles.
That is what the concept of hysteresis was about. That was one of the things my PhD contributed – I was one of the first to develop that concept in the literature in the 1980s.
The idea is that structural shifts accompany cyclical shifts and so there is no determinant NAIRU and estimates of it will just follow the actual unemployment rate up and down in some lagged fashion depending on the econometric technique used to estimate it.
And, when one examines the alleged structural factors (proposed by proponents of the NAIRU concept) using all sorts of statistical and econometric tools – from simple linear regressions to advanced techniques (non-linear, filters, etc) the overwhelming result is that the structural variables, are, themselves, highly sensitive to the economic cycle.
Which means if the actual unemployment rate falls, the estimated NAIRU falls (and vice versa).
Which means that if governments stimulate the economy using fiscal policy and reduce the unemployment rate, they create their own non-inflationary space in the process.
Please read my blog posts:
(a) A Job Guarantee job creates the required extra productive capacity (October 2, 2013).
(b) Long-term unemployment – stats and myths (August 17, 2009).
(iv) OECD delakoa
2. The reliability of the NAIRU estimates are low (see below). The NAIRU is what we call an unobserved variable so it has to be estimated using proxy indicators.
The problem as I show below is that the usual statistical estimates are so imprecise – very large confidence intervals.
So we sometimes see estimates of between 4 and 12 per cent being within points of statistical indifference – meaning the estimates are useless for policy making.
3. We always see the pools of long-term and short-term unemployment being accessed by employers when there is strong enough employment growth, which means that there are no structural impediments to growth as a result of a large pool of long-term unemployment.
The so-called ‘irreversibility hypothesis’ claimed that the long-term unemployed require extensive re-training before they are ready for work.
Further, if the government tries to stimulate employment growth to reduce the long-term unemployment rate, the irreversibility properties will mean that wages growth will rise strongly as employers compete for skilled workers and ignore the long-term unemployed and inflation will result.
The long-term unemployed thus represent a constraint on non-inflationary growth and the only solution is to force them to upskill through various rules on their income support payments, including cancellation.
The proposition that there were structural impediments (and elevated NAIRUs) was the centrepiece of the OECD’s Jobs strategy in the 1990s that developed the idea of full employability and a focus on supply-side explanations for mass unemployment (lazy workers with poor attitudes that didn’t have skills, etc).
Like most of the mainstream dogma, the concept failed as soon as data was applied to it
(v) Grafikoak eta NAIRU estimazioak
4. What we end up with is the observation that the estimates of the NAIRU provided by agencies all around the world really just track the actual unemployment rate and provide no independent information upon which to base policy shifts.
We can get as good a NAIRU estimate using a moving-average filter of the actual unemployment rate. And, of course, that provides nothing new by way of information or theoretical rigour.
But the central bankers and treasuries around the world continue to plug away with attempts to estimate it.
The reason is that without it, they have no capacity to link activity (the real economy) with price movements (the nominal economy).
And without that, their antagonism to fiscal policy and their bias towards monetary policy as the principle counterstabilisation tool has no foundation.
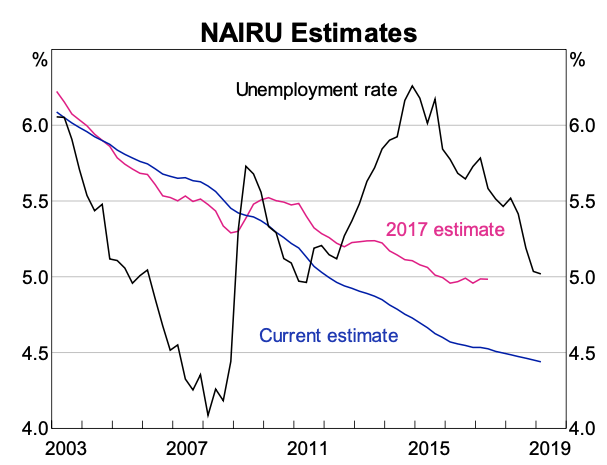
In June 26, 2019, the RBA held a so-called ‘Teacher Immersion Event’ and a paper – Understanding the NAIRU – was presented.
These graphs were shown.
First, the changing NAIRU estimates relative to the actual unemployment rate.
Second, the confidence intervals around the estimates from the early 1980s to 2019.

The general impression is that essentially, the NAIRU follows the unemployment rate with some lag.
There are high standard errors when the actual unemployment rate is moving about a lot.
And in 1997, the RBA published a Research Paper – Is the Phillips Curve A Curve? Some Evidence and Implications for Australia – which produced this graph (Figure 8).
It shows the confidence intervals around the estimates of the NAIRU between 1960 and 1997.

Summary: Huge and unusable as a precise policy tool.
According to that research one could be equally confident, in say 1985, that the steady-state unemployment rate was at 9 per cent or 4 per cent (about).
As this recent RBA research paper concluded (Source):
… the path of the NAIRU estimated now can look quite different to the path estimated at various times in the past, even using the same model and data history. The high degree of uncertainty around the NAIRU estimates means new data can change the estimate of the NAIRU for the previous few years …
Because of the uncertainty around the NAIRU, the estimates generated by incorporating new data each quarter can move around much more sharply than the estimates made with the benefit of hindsight and the full history of the data.
This – dynamic graph – from the RBA June Bulletin shows the evolution of different NAIRU estimates as the estimation sample changes.
The most recent NAIRU graph from the RBA with Confidence Intervals is this one. The intervals are still rather large even at low unemployment rates.

So given the actual unemployment rate in that year was 8.2 per cent, the Federal government should have introduced a massive fiscal stimulus to drive the unemployment rate down to 4 per cent, without fear that the inflation rate would rise.
Instead, they drove the fiscal deficit down from 2 per cent of GDP to 0.9 per cent of GDP and over the next two years, GDP growth slumped from 5.3 per cent in fiscal year 1984-85 to 2.5 per cent in 1986-87.
And the unemployment rate hovered above 8 per cent until the 1988, only to rise again above 10 per cent during the 1991-92 recession.
Usefulness of NAIRU estimates for policy: Zero!


