
Bill Mitchell-en Growth outlook deteriorating – and don’t blame the Brexit vote1
(i) Sarrera2
(ii) AEBko kasua eta defizit fiskala irtenbide gisa3
(iii) AEB eta eurogunea: konparaketa4
Consider the following graph
(iv) AEBko ekonomia
The first graph shows the annual real GDP growth rate5
The next graph shows the evolution of the Private Investment to GDP6
The next graph shows the actual real GDP for the US (in $US billions) and two estimates of the potential GDP7
Nola ebaluatu aurreko bi estimazioen arteko desberdintasuna8
(v) Hazkunderako ekarpenak
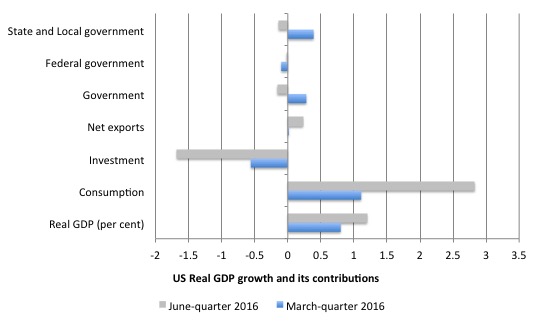
The next graph compares the March-quarter 2016 (blue bars) contributions to real GDP9
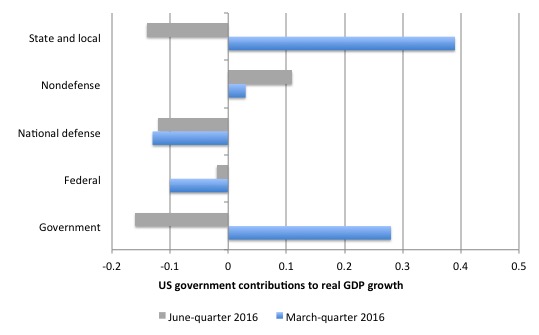
The next graph decomposes the government sector and shows the substantial reversal in growth contribution from the State and Local government sectors
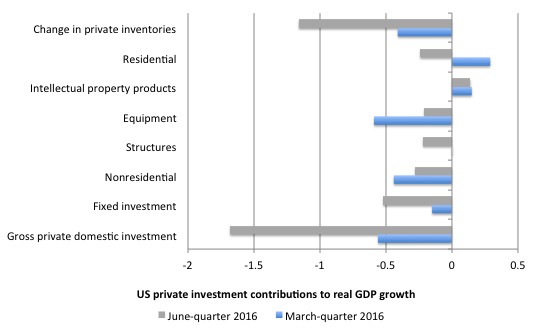
The next graph shows the contributions to real GDP growth of the various components of investment10
Ondorioak:
AEBko ekonomia motelduta, inbertsio pribatuko gastuak hazkunde negatiboan eta gobernu sektoreko parte hartze negatiboa11, hortaz
“... with private business investment faltering, the federal government’s deficit is now too low to support stronger growth and labour underutilisation rates remain elevated (and excessive)”
Aipatutako horrek guztiorrek ez dauka inongo zerikusirik Brexit-ekin.
NAIRU eta Europar Batasuna direla eta, gogoratu EBZ: hedakuntza fiskala behar da!
Bertan aipatzen denez:
“Output hutsunearekin aritzeko biderik hoberena politika fiskalaren norabidea aldatzea [da] (austeritatea alboratuz) eta bera finantzatzea EBZ-ren bidez”
Beraz, ekonomian agertzen diren hazkundearen gabeziek ez dute behar inolako politika monetario berezirik, politika fiskal berria baizik, alegia defizit publikoak handitzea, aspalditik ezagutzen dugunez.
Gehigarriak:
Overt Monetary Financing delakoaz, ikus, besteak beste:
eta
Stephanie Kelton @StephanieKelton
Drop the “pump-priming” stuff, and this has been our position for decades. http://bilbo.economicoutlook.net/blog/?p=23673
“There is nothing intrinsically good or bad about any specific budget outcome.
In response to the 1982 attempt by conservative politicians to pass a Balanced Budget Act in the US Congress, the revered macroeconomist Gardner Ackley said:
My own position on deficits has always been, and remains, that deficits, per se, are neither good nor bad. There are times when they are not only appropriate but even highly desirable, and there are times when they are inappropriate and dangerous. During a recession or a period of “stagflation”, deficits are nearly unavoidable, and are likely to be constructive rather than harmful.
This blog – A voice from the past – budget deficits are neither good nor bad – has more discussion about Gardner Ackley.
To add meaning to the discussion we have to relate the budget outcome to the circumstances in the economy rather than be side-tracked by some pre-conceived notion that some balance is desirable and another is not.
It is not the government’s role to run deficits or surpluses. We want governments to make policy choices that will maximise the potential of the people to enjoy their lives and contribute the best they can, given their own circumstances to the well-being of society and the planet.”
1 Ikus http://bilbo.economicoutlook.net/blog/?p=34082#more-34082.
2 Ingelesez: “Last week, National Accounts data for the June-quarter 2016 was published for the US and the Eurozone and we learned that the next slowdown is happening now, even though neither economy has yet fully recovered from the last downturn (the GFC). Data from the UK is similarly poor, which suggests to me that the Brexit hoopla (where everything bad is blamed on the Exit vote success) is misplaced.”
3 Ingelesez: “In the case of the US, there is now a marked slowdown underway and the growth rate has been in decline since the March-quarter 2015. Private consumption expenditure remained strong and there was a substantial decline in the personal saving ratio as households spent a much higher proportion of their disposable incomes to fund their growing consumption. The other standout result was the decline in Private capital formation (investment), for the third consecutive quarter and the fact that its rate of decline is accelerating signals a lack of confidence in the medium-term outlook by business firms. The government sector also undermined growth in the June-quarter 2016. With inflation still well below the implicit central bank target rate (2 per cent) and growth is faltering the outlook suggests that the federal government will need to increase its discretionary fiscal deficit to stimulate confidence among business firms and get growth back on track.”
4 Ingelesez: “US and Eurozone comparison
In the Eurozone, austerity caused the stagnation and the Eurozone remains locked into a struggle with deflation and stagnant economic growth which is not being driven by capital formation, thus underpinning growth in potential GDP as well as supporting current spending.
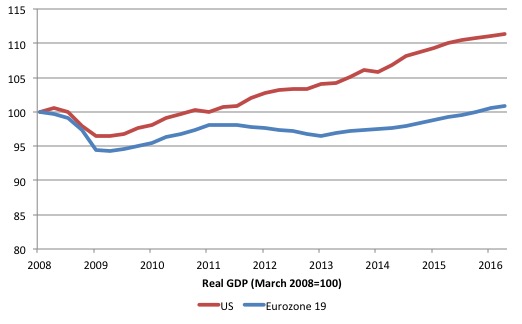
Consider the following graph. The first shows the evolution of real GDP indexed to 100 at March 2008 for the Eurozone 19 Member States and the US up to the June-quarter 2016.
The initial downturn was similar in speed and ferocity for both economies, with the Eurozone trough 2 per cent deeper.
The early fiscal stimulus in Europe (driven by both some discretionary measures and the operation of the automatic stabilisers) saw some positive growth response and for a time (from a lower base), both economies were growing at about the same rate.
But that is where the similarity ends. The Eurozone growth was curtailed by nothing other than the bloody-minded incompetence of Brussels as they imposed the Stability and Growth Pact (SGP) rules (more or less) and fiscal austerity was prioritised.
It took until the December-quarter 2015 (31 quarters) for the 19 Eurozone Member States to finally pass the March 2008 peak and after 33 quarters (June-quarter 2016), the aggregate Eurozone real GDP is only 0.8 percentage points above that peak.
So the Eurozone bloc endured cumulative real output losses for 7.75 years and now the world is approaching the next cycle. The rate of real GDP growth slowed again in the June-quarter.
In contradistinction, is the performance of the US economy, even though by any standards its recovery has been pretty weak.
Compared to the Eurozone growing by only 0.8 percentage points between the March-quarter 2000 and the June-quarter 2016, the US economy grew by 11.3 per cent.
However, the gap between the two large economies, which accelerated as Brussels killed growth in 2011, has now remained steady as both economies start slowing down.”
5 Ingelesez: “US economy – what is going on?
On July 29, 2016, the US Bureau of Economic Analysis released their ‘Advance Estimate’ of – Gross Domestic Product, Second Quarter 2016 – which showed that the June-quarter real GDP growth estimate was slightly above the March-quarter outcome (0.3 per cent compared to 0.21 per cent).
However, on an annualised basis, the US economy slowed rather appreciably to 1.2 per cent per annum in the June-quarter 2016 (down from 1.6 per cent in the March-quarter 2016).
Compared to the corresponding quarter last year (June 2015), when the annualised real GDP growth rate was 3 per cent, the 1.2 per cent result in the June-quarter 2016, is a significant deterioration.
In fact, the peak real GDP growth rate was 3.3 per cent in the March-quarter 2015, and each subsequent quarter since has seen a deterioration in the performance of the US economy.
The following sequence of graphs captures the story.
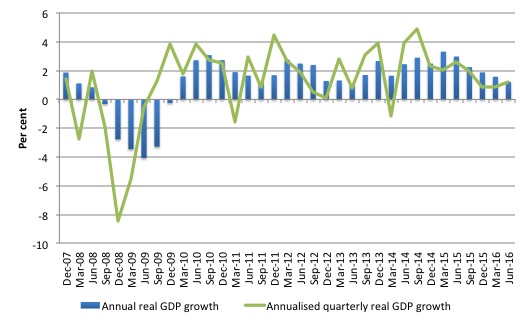
The first graph shows the annual real GDP growth rate (year-to-year) from the peak of the last cycle (December-quarter 2007) to the June-quarter 2016 (blue bars) and the annualised last quarter growth rate (green line). The data is available – HERE.
The steady trend slowdown in annualised real GDP growth since the March-quarter 2015 is evident.
The year-to-year growth calculation smooths out the considerable volatility in the quarterly data to help us see the trend.
It is too early to predict a US recession is coming but policy has to change given the consistent deterioration in private investment (see later).”
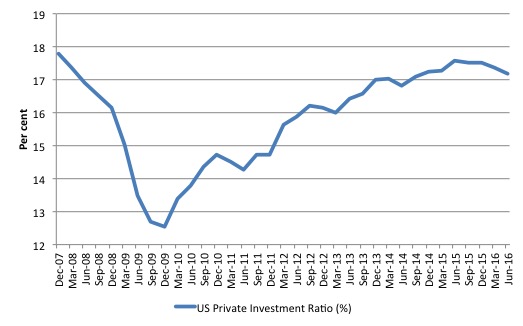
6 Ingelesez: “The next graph shows the evolution of the Private Investment to GDP ratio from the December-quarter 2007 (real GDP peak prior to GFC downturn) to the June-quarter 2016.
The decline in the investment ratio as a result of the crisis was substantial and endured for 2 years. As a result the potential productive capacity of the US will have contracted somewhat.
Since the June-quarter 2015, the Investment ratio has once again been in retreat and dropped from 17.6 per cent to 17.2 per cent of GDP by the June-quarter 2016.
The decline in capital formation came before but it had reached the pre-GFC levels (18 per cent – September-quarter 2007) and is a major reason that the overall economy is in retreat.”
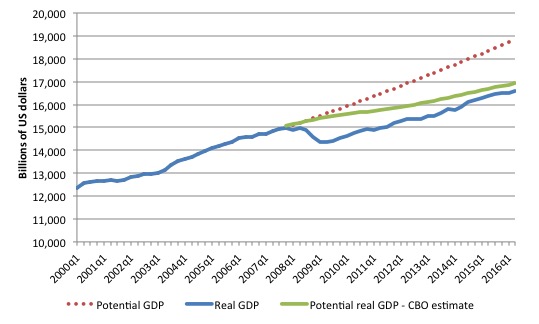
7 Ingelesez: “To get some idea of what has happened to potential real GDP growth in the US, the next graph shows the actual real GDP for the US (in $US billions) and two estimates of the potential GDP. There are many ways of estimating potential GDP given it is unobservable.
While I could have adopted a much more sophisticated technique to produce the red dotted series (potential GDP) in the graph, I decided to do some simple extrapolation instead to provide a base case.
The question is when to start the projection and at what rate. I chose to extrapolate from the most recent real GDP peak (December-quarter 2007). This is a fairly standard sort of exercise.
The projected rate of growth was the average quarterly growth rate between 2001Q4 and 2007Q4, which was a period (as you can see in the graph) where real GDP grew steadily (at 0.68 per cent per quarter) with no major shocks.
If the global financial crisis had not have occurred it would be reasonable to assume that the economy would have grown along the red line (or thereabouts) for some period.
The gap between actual and potential GDP in the fourth-quarter 2015 is around $US2,276 billion or around 12.1 per cent. That gap has been rising steadily sine late 2014 after it had stopped rising around 2013 because real GDP was once again growing about as fast at it did, on average in the 6 years before the crisis.
But now growth is slowing and so the gap is rising again.
The green line is the estimate of potential output provided by the US Congressional Budget Office and made available through – St Louis Federal Reserve Bank.
Their output gap estimate (difference between actual and potential) for the June-quarter 2016 is 2.2 per cent, which is clearly less than that derived from a simple extrapolation. It has also been increasing over the last 4 quarters.”
8 Ingelesez: “How should we assess these two estimates of the output gap?
CBO define Potential GDP as “the level of output that corresponds to a high level of resource—labor and capital—use.”
They explain their estimation methodology in the document – A Summary of Alternative Methods for Estimating Potential GDP.
I discussed the methodology and limitations in these blogs – Structural deficits and automatic stabilisers and US problems are cyclical not structural.
For those who want even more technical detail, please consult my 2008 book with Joan Muysken – Full Employment abandoned – where we provide a mathematical and econometric discussion of the techniques that the CBO uses.
By way of summary (…), The resulting estimate of Potential GDP is “an estimate of the level of GDP attainable when the economy is operating at a high rate of resource use” and that if “actual output rises above its potential level, then constraints on capacity begin to bind and inflationary pressures build” (and vice versa).
So despite saying that their estimate of Potential GDP is “the level of output that corresponds to a high level of resource—labor and capital—use” what you really need to understand is that it is the level of GDP where the unemployment rate equals some estimated (unobservable) Non-accelerating Inflation Rate of Unemployment (NAIRU).
Intrinsic to the computation is an estimate of the so-called “natural rate of unemployment” or the NAIRU which is the mainstream version of ‘full employment’ but is, in fact, a conceptual unemployment rate that is consistent with a stable rate of inflation.
The literature demonstrates that the history of NAIRU estimation is far from precise. Studies have provided estimates of this so-called ‘full employment’ unemployment rate as high as 8 per cent or as low as 3 per cent all at the same time, given how imprecise the methodology is.
The former estimate would hardly be considered ”high rate of resource use”. Similarly, underemployment is not factored into these estimates.
Also, recall how the European Commission estimated that the Spanish NAIRU jumped from around 12 per cent to around 25 per cent in a short period. Nonsense!
The concept of a potential GDP in the CBO parlance is thus not to be taken as a fully employed economy. Rather they use the devious shift in definition in mainstream economics where the concept of full employment is not constructed as the number of jobs (and working hours) that which satisfy the preferences of the available labour force but rather in terms of the unobservable NAIRU.
The fact is that these estimates will typically underestimate (by some margin) the true scale of the existing output gaps because the estimated NAIRU is never above the irreducible minimum unemployment rate, the latter reflecting frictions in the labour market as people move between jobs.
You may also like to read this blog – Demand and supply interdependence – stimulus wins, austerity fails – where I discuss the US Federal Reserve Bank’s recent updated estimates of potential GDP.
Both potential GDP estimates in the graph above (the red dotted linear extrapolation and the CBO green estimates) are extremes and the truth is somewhere in between the two.
It is clear that the decline in the Investment ratio will have caused the potential GDP growth to slacken somewhat, which means the red dotted line is an upper limit.
The continued poor state of the labour market with still elevated levels of unemployment and high underemployment would mean that the output gap is likely to be closer to 11 per cent than 2.2 per cent.
The problem then is that the resulting decline in potential real GDP growth reduces the space that the economy can grow within without hitting capacity ceilings. In turn, this locks in higher than necessary labour underutilisation rates.
The other relevant point about the graph is that it defies those who want to characterise the main US problem as being structural (labour market rigidities etc). The US would not have fallen off the cliff as it did in early 2008 if that was the case. Structural deterioration is gradual and cumulative not sudden and sharp.”
9 Ingelesez:” The next graph compares the March-quarter 2016 (blue bars) contributions to real GDP growth at the level of the broad spending aggregates with the June-quarter 2016 (gray bars), where the overall real GDP growth was 1.2 per cent.
The main aggregate source of growth came from Private consumption spending (a stunning 2.83 percentage points) up from 1.11 percentage points in the March-quarter 2016.
It is hard to interpret the trend in private consumption growth given it was slowing down in the second-half of 2015 but has since accelerated again.
American household debt remains high and uncertainty is increasing. So how that impacts will remain to be seen.
The contribution of Private investment spending has been negative for the third consecutive quarter which does not augur well for the medium-term outlook and largely explains the slowing growth.
The negative contribution is also growing in magnitude.
The Government sector undermined growth in the June-quarter (by -0.16 points) after contributing 0.28 points in the March-quarter 2016. This is the first negative Government-sector contribution to real GDP growth since the December-quarter 2014.
In the June-quarter 2016, both the federal and state/local government’s contribution were negative (-0.02 and -0.14 points, respectively).
The other contributor to growth was Net exports (0.23 points).”
10 Ingelesez: “The next graph shows the contributions to real GDP growth of the various components of investment. It is here that we see why total real GDP growth has been declining.
The only positive contribution came from Intellectual property products (0.14 points). All other components undermined growth.
US firms have been shedding inventories since the June-quarter 2015 (five consecutive negative contribution quarters), which means the inventory cycle has well and truly turned down as firms have cut production growth and can meet current consumption growth with existing inventories.
A sustained downturn in the inventory cycle signals on-going weakness in the economy.”
11 Ingelesez: “Conclusion
While the June-quarter real GDP growth estimate was slightly above the March-quarter outcome (0.3 per cent compared to 0.21 per cent), on an annualised basis, the US economy slowed rather appreciably to 1.2 per cent per annum in the June-quarter 2016 (down from 1.6 per cent in the March-quarter 2016).
Compared to the corresponding quarter last year (June 2015), when the annualised real GDP growth rate was 3 per cent, the 1.2 per cent result in the June-quarter 2016, is a significant deterioration.
In fact, the peak real GDP growth rate was 3.3 per cent in the March-quarter 2015, and each subsequent quarter since has seen a deterioration in the performance of the US economy.
A major driving factor has been that Private investment expenditure has recorded three consecutive quarters of negative growth.
A contributing factor was the negative contribution from the government sector (all levels).
Clearly household consumption expenditure is holding up but it is unclear how long households will keep running down the saving ratio, especially given that the private sector has elevated levels of debt.
In general, I conclude that with private business investment faltering, the federal government’s deficit is now too low to support stronger growth and labour underutilisation rates (U6) remain elevated (and excessive).”


